www.
nexmedia
.co.za
In fact Helen Burt, customer experience operations manager at eDigitalResearch,
offered this great insight on the importance of choice as she participated in
the webinar that preceded this post at
/
understanding-mulitchannel-experiences.html
(Spelling mistake is as
per the link)
‘We’ve found that in some circumstances and projects the customer journey is so
complex that actually attempting to map journeys is too labour intensive and not
that useful. The important thing is to ensure that all channels are available and
working well, but perhaps prioritise those channels which are most appropriate
for each type of journey.’
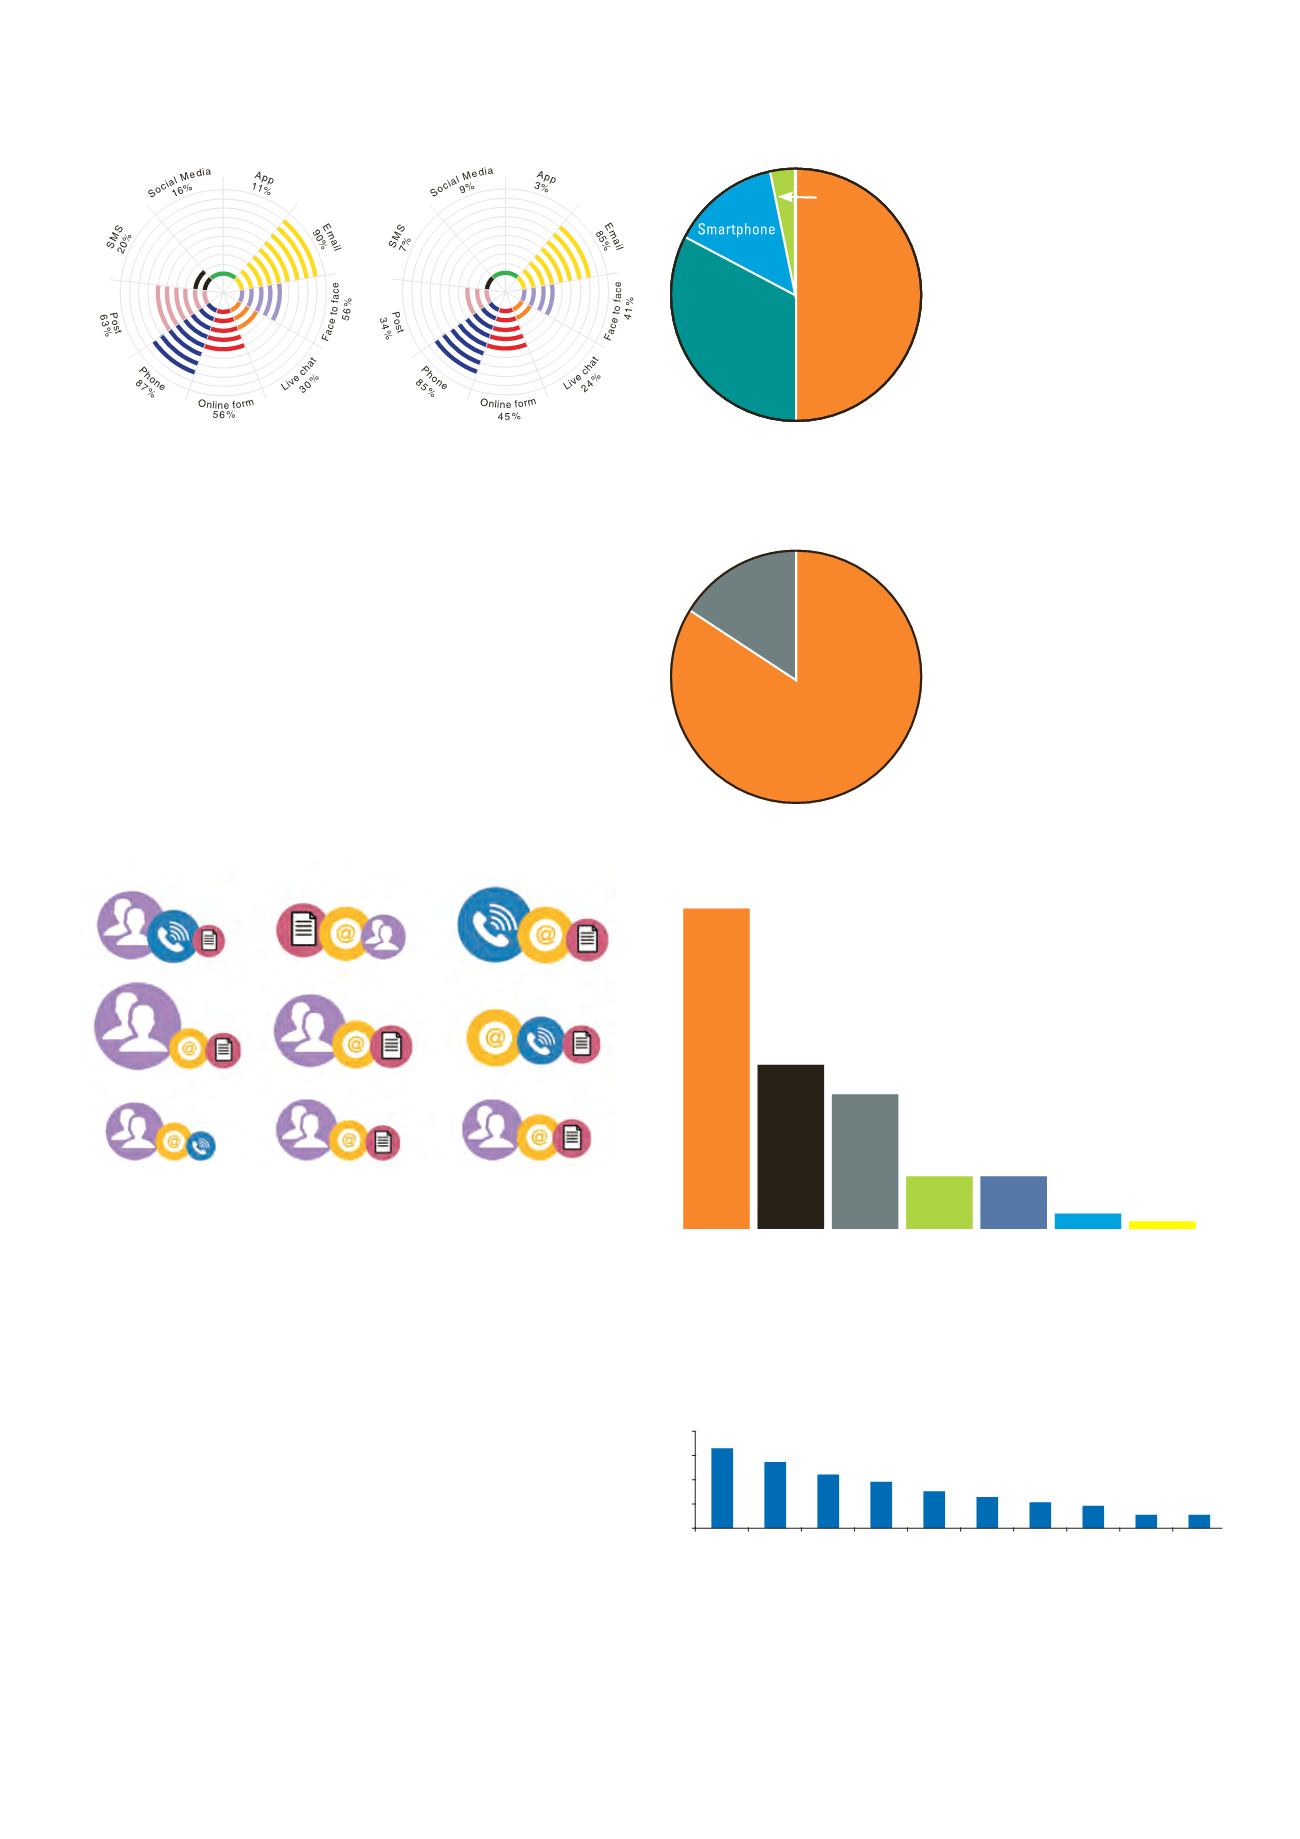
If customer behaviour is indeed too complex to map then consider the following
analysis; also included in the eDigitalResearch study. It shows channel choice
and use is a function of the type of situation and activity customers find
themselves in.
This means talking about channel preferences makes best sense in the context of
the type of organisation you are and the tasks that customers undertake with you.
So, if we conclude that customers are driving the agenda on channel choice how
do we practically implement this design principle?
One way of mapping channel preferences is to ask customers! Do this whenever
you are on-boarding a new customers or at a significant point of regenerating the
relationship such as annual renewals. Once this information is captured in your
CRM, it can be used as a business rule to use the preferred channel of choice.
It is much smarter to ask than to guess. For instance this is the view of another
webinar participant. She represents the so called autonomous customer who is
naturally drawn to self-service. ‘Personally I think if I have to actually speak to a
brand, its last resort. I would much rather resolve an issue myself.’
UK versus US: Showing much of the same behaviour
Is what we have discussed so far just a UK perspective? US research suggests
not. New forms of customer behaviour is just as rampant. A recent Ovum study
of more than 8000 consumers showed that 74 percent now use at least three
channels when interacting with an enterprise brand or organisation for
customer-related issues.
Parature’s 2014 State of Multichannel Customer Service Survey shows a similar
diversity of device use.
The reason why online (labelled ‘computer’ in the pie chart) is so prevalent is
simple. It is all to do with where customers most frequently start their journey.
Such as using a search engine to try to self-serve or finding an organisation’s
contact details.
But once that is done, notice how old preferences then reassert themselves. As
we stated at the outset, live voice remains the channel to beat in many sectors.
One of the intriguing questions here is whether we are destined to always have
live voice at the centre of our channel mix? To be more precise, is this being
forced on customers or does it reflect the real demand?
Certainly there is wide selection of channels in play as this 2013 global call
centre study from Deloitte shows.
At face value, this would suggest a more balanced channel mix is being used.
However, once we revert to actual usage figures and customer preferences, the
old preference can be clearly seen. Here are a couple of insights reflecting how
customers judge channel effectiveness. ContactBabel’s 2013 studies of US and
UK channel usage (The Inner Circle Guide to Multi-channel Customer Contact)
show the domination of voice in both markets (US is blue, UK is green)
Nex Media • MULTI-CHANNEL EXPERIENCES – WHY CONTACT CENTRES ARE FAILING
What device do you use most
often to start or complete a
customer service interaction?
Have you ever used a search
engin to look for an answer to a
customer service question?
What is your preferred channel for
seeking customer service?
Computer
(Laptop or desktop)
Telephone
Banking and finance
Holiday and travel providers
Utilities (e.g. gas, electricity)
Groceries/Supermarkets
Clothing, shoes, accessories
Banking and finance
Car manufacturers
White goods (e.g. washing machine)
Personal electronic device
16%
No
84%
Yes
Tablet
82%
Telephone
43%e
22%e
18%e
7%e 7%e
2%e 1%e
Email
Live Chat
In Person Portal
Social
Community
100%
68%
56%
48%
38% 33% 27% 23%
14% 14%
Email
Voice
Fax
Paper/Mail
Mobile
Social
Media
Web – Self
Service
Web –
Collaboration
Virtual
Assistant
Video
75%
50%
25%
0%
When contacting a company in the following sectors for a general
enquiry, what would be your prefered method of contact?
3
7
%
4
3
%
3
9
%
3
9
%
2
3
%
2
6
%
2
5
%
2
6
%
3
1
%
3
1
%
3
4
%
3
4
%
2
8
%
2
0
%
2
0
%
2
0
%
1
8
%
1
5
%
1
7
%
1
8
%
2
0
%
2
1
%
1
9
%
2
2
%
2
4
%
1
6
%
Expectation
Usage
16


